 Wouldn’t it be great if you could know almost everything there is to know about those nameless and faceless visitors that come on your website?
Wouldn’t it be great if you could know exactly how people get to your site, what they type in the the search engines to find you or how many leads you get from Facebook and Twitter?
Wouldn’t it be great if you could also know where they are from, what type of computer they are using, how many people access your site with mobile phones and how long they stay on your website?
Well, I have a good news for you, YOU CAN …. and it’s entirely FREE. It’s called Google Analytics.
What is Google Analytics?
What is it exactly?
Google Analytics (GA) is a service offered by Google that generates detailed statistics about a website’s traffic and traffic sources and measures conversions and sales.
Google Analytics is one of those things that is too good to be true. I still don’t understand how Google can give away something this amazing for free, is still astonishes me. Of course, they get a ton of data from your website in return but it still is an amazing offer.
Should you get it for you website? Absolutely, it is free and all you need is a Gmail account to get started. However, once you get started, it can be quite overwhelming. There is A LOT of information and you need to understand what it is and how to benefit from it. This is what this article is all about.
The most important metrics for your business
Just like any business or profession, there are tips and signals that you should analyze to determine if things are going in the right direction with your website.
We’ve have come up with ten vital Google Analytics metrics for you as business owners to help you get started.
1. Visits
This is probably the first and most important statistic in Google Analytics. Aside from the ego boost to get a lot of visitors, every business is interested in knowing the number of visitors their website is getting, because these are the main ingredient for potential buyers, followers or customers.
There are two main types of visitors that you should take into consideration: the returning visitors and new visitors. Even without explanation, it is pretty self explanatory. Google uses cookies on your visitors’ computers to determine if they have been to your website before or not.
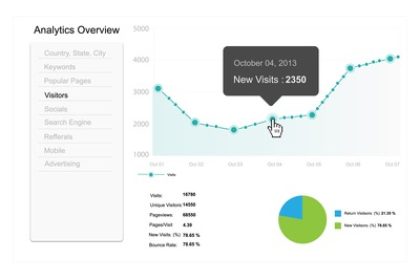
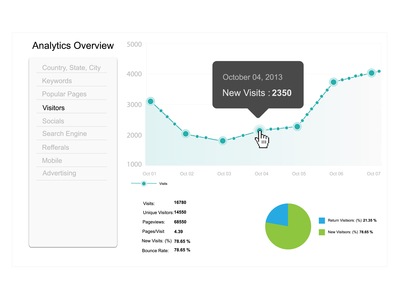
The percentage of new visitor vs returning visitor can vary a lot between websites. If, for example, you have an informational website with very precise information (such as the one in the picture above) you will get a low number of returning visitors because they just go to your website to look for a specific information and then leave never to come back again. However, if you sell products or have an information website with fresh new content regularly, you will start to develop a following and people will come back to get more of the same.
If your new visitors find your products, services or information interesting and engaging they are more likely to come back and this is key to sustaining a business online. Most people won’t buy on their first visit and the higher the percentage or returning visitor, the better.
Tip: To get more visitors you can optimize your site for search engine optimization, start PPC campaigns, build a mailing list or attract visitors through Social Media.
2. Visitors Average Pageviews/Visit
The average pageviews per visit is an important metric that let you know how engaging your website is. The more page views your website is getting the more likely it means that the content posted on your site is engaging enough to push your visitors to the other pages of your website.
For a business page with only a few pages such as About, Services, Prices and Contact, any score higher than 2 is good because it means that visitors are not only coming to your site to leave right away and that they take the time to go through your site, which gives you more opportunity to convert them.
However, if you have seventy pages on your site and that average pageviews/visit is at 2.2, then Houston, you have a problem.
Tip: To increase the pageviews/visit, you can show your most popular posts in the sidebar or at the bottom of your article, you can add internal links to your own website inside your articles.
3. Average Visit Duration
This statistic shows the average time each visitor is staying on your website. This metric is quite complementary to the average pageviews/visit.
The first interpretation of this stat that you would go for is that the longer the duration the better, this is to some extent true. The first step that you should take when taking into consideration this statistic is the type of content you have on the page. For instance, if you have five pages and they comprise fifteen minute videos on each page and majority of your visitors are not staying any more than three minutes, then this could mean that they are not following through to the end of your content and are likely missing out on various call to actions which could in turn affect your conversion rates.
4. Bounce Rate
The bounce rate shows the number of visitors that came to your website but left right away without looking at any other pages on your site, hence the name bounce rate. You obviously want to have a bounce rate as low as possible to try to convert your visitors.
It could mean a lot of different things, either:
- The visitors for a specific information and they found it in the page they got to.
- The design or presentation of your website didn’t appeal to the visitors and they are not interested in reading what else you have to say.
- You didn’t display the other pages on your site properly.
Tip: Same as for the average pageviews/visit, you can try to display your most popular posts in the sidebar or at the bottom of your article, you can add internal links to your own website inside your articles or you might also need to redesign or refresh your website.
5. Traffic Sources
These statistics are presented based on four source segments of traffic; search engines, referring sites, direct traffic and others.
Search Engines – this covers all traffic tapped from search engines like Google, Yahoo, Bing and many others. This is possible if your website is appearing in the search results of the search engines.
Referring Sites – this is traffic brought due to links found on other websites other than yours.
Direct Traffic – this is traffic brought in as a result of direct keying in or your website name (URL) on the address bar.
These analytics help you note where you need to put in more effort. For instance, if the search engines are providing you with the best traffic, then work on that. Different sources work for different businesses. As such it’s very advisable that you stick to what works for you.
6. Keyword
This shows which keyword the visitor typed into to Google and eventually led them to your site. This is very essential in the sense that it will highlight to you which keyword is bringing you your main traffic. For instance, you as a website owner may have four keywords you are targeting and it only happens that your secondary keywords are the ones bringing you the best traffic compared to your main keyword. This could be as a result of less or competition or relevance, then this should add to the reasons why you should focus on those keywords compared to your main one.
7. Landing Page
Your promotion strategy often determines what your most visited landing page will be. Sometimes, the page which you may have taken for granted or paid less attention to ends up getting the most traffic. This could be due to reasons such as social shares, content and keywords among others. Google Analytics has a list of all pages of your site and shows the source of the traffic, number of visits and the bounce rate.
The source of traffic, which your best pages is getting will enable to concentrate on that strategy to help boost your traffic to similar pages and the bounce rate will quickly signal that there is something that your visitors do not like about your pages. Try to get someone independent, a friend or someone you meet in cafe to give you clear minded critique of your best landing pages.
8. Location
If you run a website centered on a particular area, then this is a statistic worth taking note. For instance, you are promoting a weight loss product specifically aimed at the English market, then you will probably be very happy to see more visitors from England. You can also increase your traffic by putting in some local promotion like magazines or classified adverts. This stat will in effect, help you direct your efforts.
9. In-Page Analytics
These analytics focus on the click through rate of the links on your website. It is based on the number of visits you get on the page and the number of clicks you are getting. This is also known as conversion. This is probably one of the main reason why most businesses online exist; this is so because every click entails an action. These statistics will help you determine how well your page is converting. If your bounce rate on the page is low and average duration per visit is good, then you may consider twitching your call to actions.
10. Mobile
Lastly, the mobiles section of the analytics. This shows the number of visitors that used mobile devices to visit your site. If this number is high or is reasonable, you may want to consider creating a mobile version of your website. This will help increase the ease of navigation for your mobile visitors and their conversion as well. With the improvement in security and sophistication in mobile technology, it is now easier to transact via mobile devices, hence these visitors are also potential customers.
All in all, Google Analytics are a plus to your online business only if you use them to your advantage. The ten points discussed are just some of the major benefits of Google Analytics metrics. If you haven’t started using them, then start today by taking action on what you have learned.


